本文总结一下ggplot2包绘图时主题的美化。
1.theme主题
ggplot2有一些自带的常用的主题,如图:theme_bw()、默认背景theme_grey()、theme_linedraw()、theme_light()、theme_mininal()、theme_classic()、theme_void()。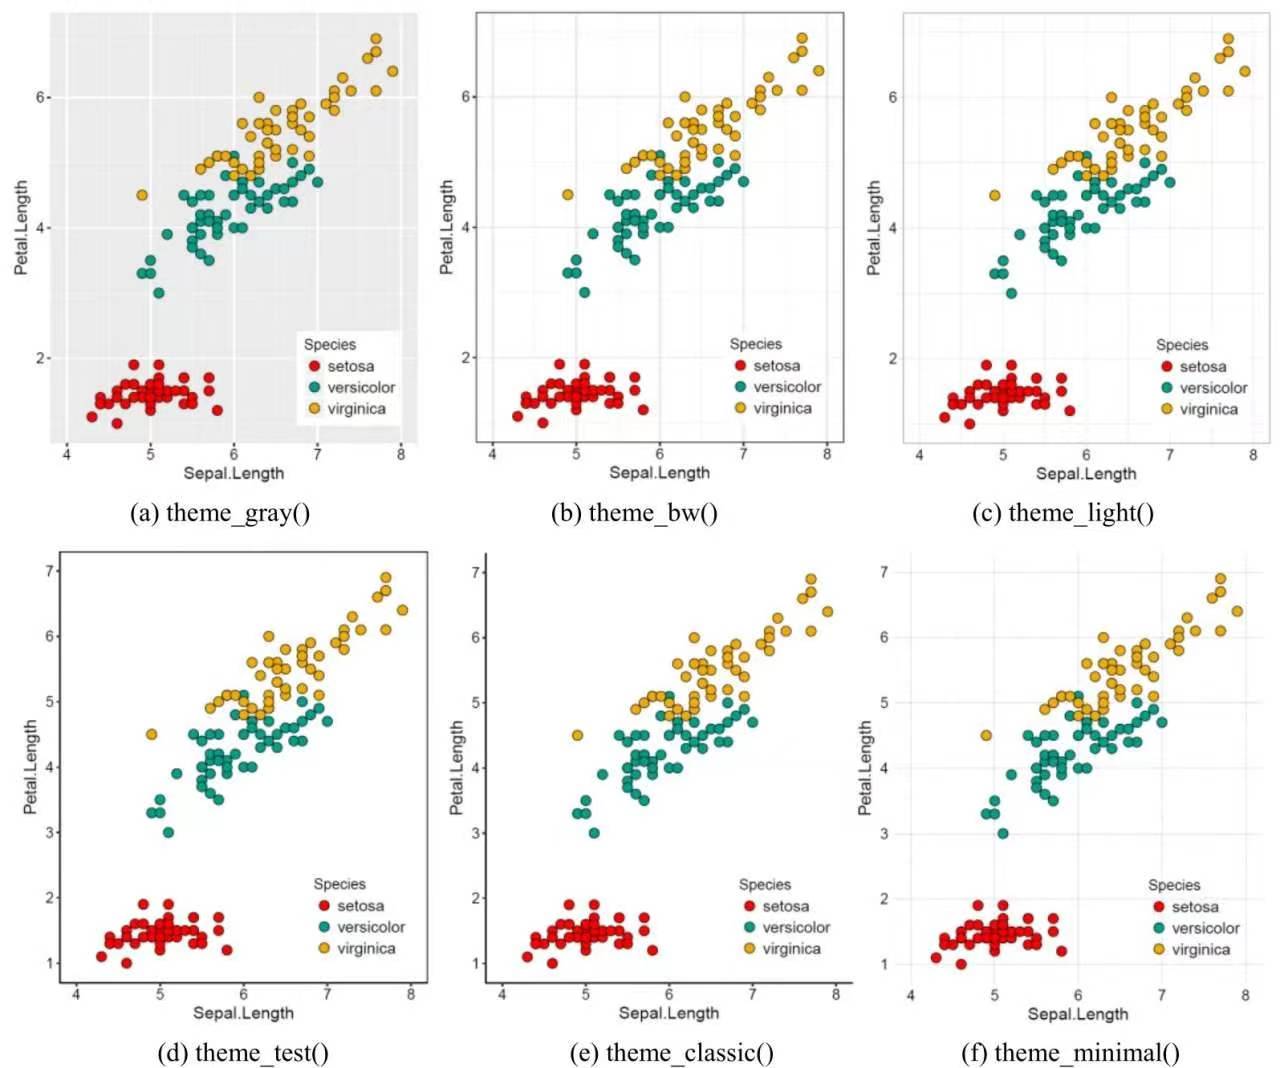
theme也可以自定义。可以将自己喜欢的theme()部分保存为变量,重复调用。
1 | mytheme <- theme(...) |
常见的四种类型:
element_text(),对文本进行设置,如title、subtitle等。
element_line(),对线进行设置,如轴线、主网格线、次网格线等等。
element_rect(),修改基于矩形的组件,如绘图区域和面板区域的背景。
element_blank(),不绘制任何东西,并关闭相关的内容设置。
1 | ggplot变量+theme(组件=element_功能()) |
例:
1 | data(diamonds) |
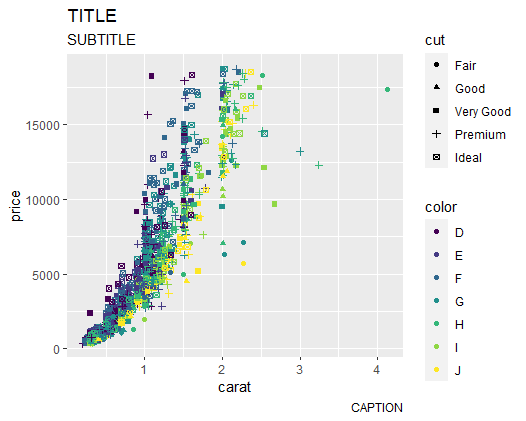
theme()函数内容:
1 | theme( |
2. 修改背景、标题,坐标轴
2.1 图像组件
| 组件 | 对应的element功能 | 描述 |
|---|---|---|
| plot.title | element_rect() | 图像标题 |
| plot.background | element_text() | 图像背景 |
| plot.margin | margin() | 图像边距 |
plot.background=element_rect(fill = NA)可以将背景矩形设为透明。
2.2 标题组件
| 组件 | 对应的element功能 | 描述 |
|---|---|---|
| plot.title | element_text() | 图片标题 |
| plot.subtitle | element_text() | 图片副标题 |
| plot.caption | elemnet_text() | 图片caption |
2.3 坐标轴组件
| 组件 | 对应的element功能 | 描述 |
|---|---|---|
| axis.title | element_text() | 坐标轴标题 |
| axis.title.x | element_text() | x轴标题 |
| axis.title.y | element_text() | y轴标题 |
| axis.text | element_text() | 坐标轴文本 |
| axis.text.x | element_text() | x轴文本 |
| axis.text.y | element_text() | y轴文本 |
| axis.ticks | element_text() | 轴须 |
| axis.ticks.x | element_text() | x轴轴须 |
| axis.ticks.y | element_text() | y轴轴须 |
| axis.line | element_line() | 轴线 |
axis.line轴线处理,默认是隐藏的。
例子:
1 | p + theme(plot.title=element_text(size=20, face="bold", #字体 |
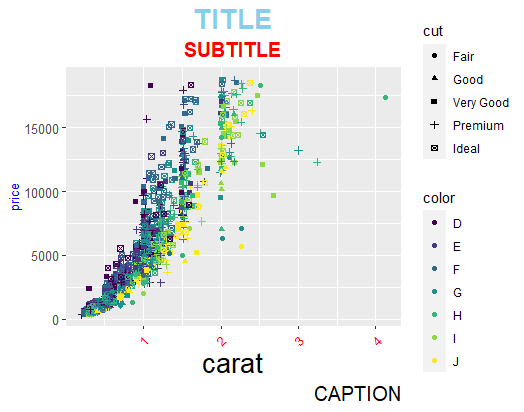
一些其他参数、函数:
vjust,控制标题(或标签)和绘图之间的垂直间距。
hjust,控制水平间距。将其设置为0.5将标题居中。
face,设置字体(“plain”,“italic”,“bold”,“bold.italic”)
unit(),用于设定网格单位,如unit(1,”cm”)或unit(0.25,”in”)
2. 修改图例
图例组件:
| 组件 | 对应的element功能 | 描述 |
|---|---|---|
| legend.background | element_rect() | 图例背景 |
| legend.key | element_rect() | 图例符号背景 |
| legend.key.size | unit() | 图例符号大小 |
| legend.key.height | unit() | 图例符号高度 |
| legend.key.width | unit() | 图例符号宽度 |
| legend.margin | unit() | 图例边距 |
| legend.text | element_text() | 图例标签 |
| legend.text.align | 0-1 | 图例标签对齐(0=右,1=左) |
| legend.title | element_text() | 图例名 |
| legend.title.align | 0-1 | 图例名对齐(0=右,1=左) |
| legend.justification | c(x,y)图例的x和y的坐标 | 将图例设置在图内部 |
| legend.position | “none”, “left”, “right”, “bottom”, “top”,or two-element numeric vector | 图例位置 |
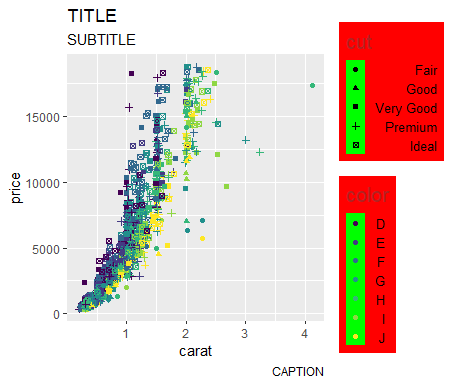
2.1 设置图例标题,文本和键的样式
例如:
1 | p + theme(legend.title = element_text(size=15, color = "firebrick"), # 图例名字 |
2.2 删除图例和修改图例位置
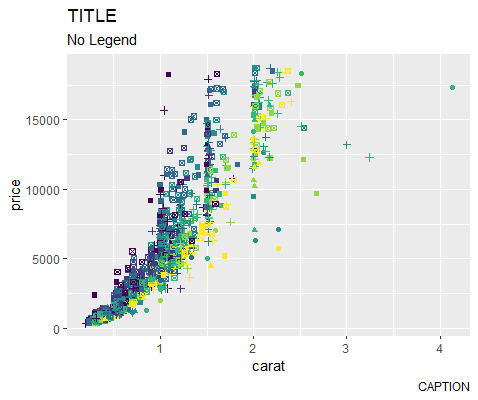
删掉图例:
1 | p + theme(legend.position="None") + labs(subtitle="No Legend") |
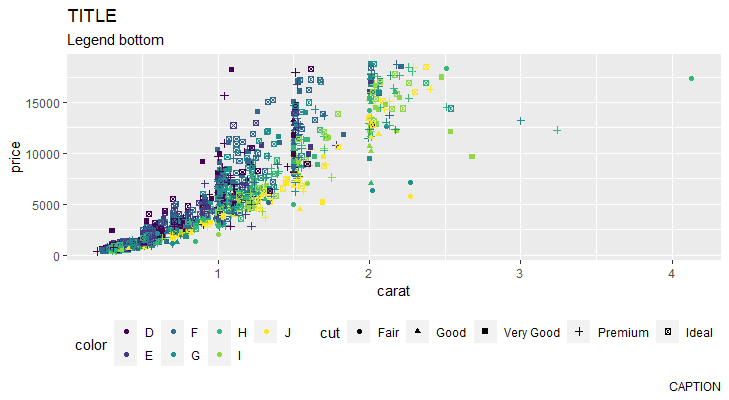
修改图例位置:
1 | p + theme(legend.position="bottom", legend.box = "horizontal") + labs(subtitle="Legend bottom") |
修改图例到图片内部:
1 | p + theme(legend.title = element_text(size=12, color = "salmon", face="bold"), |
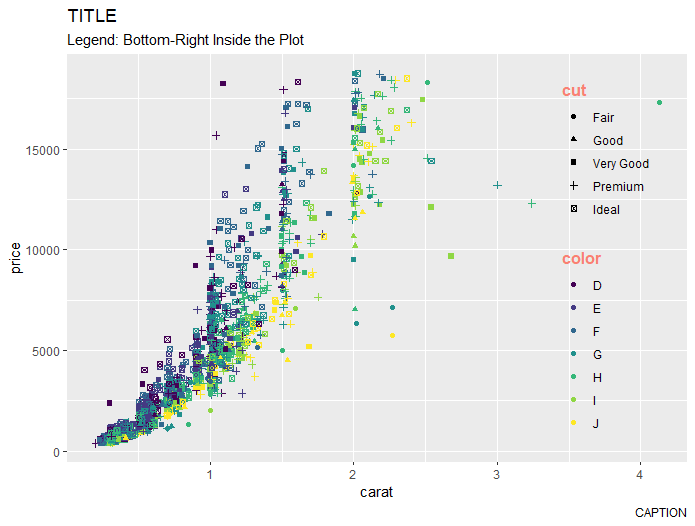
legend.position也可以用两个元素构成的数值向量来控制,主要是设置图例在图片中间所在具体位置,而不是图片的外围。数值大小一般在0-1之间,超出数值往往导致图例隐藏。
其他诸如guide_legend()或guide_colourbar()等函数也可以用来修改图例。以及向legend.position\legend.direction\legend.justification\legend.box等属性控制图例在图像中的布局。
3. 修改面板
| 组件 | 对应的element_功能() | 描述 |
|---|---|---|
| panel.background | element_rect() | 面板背景(数据下面) |
| panel.border | element_rect() | 面板边界(数据上面) |
| panel.grid | element_line() | 网格线 |
| panel.grid.major | element_line() | 主网格线 |
| panel.grid.major.x | element_line() | 竖直主网格线 |
| panel.grid.major.y | element_line() | 水平主网格线 |
| panel.grid.minor | element_line() | 次网格线 |
| panel.grid.minor.x | element_line() | 竖直次网格线 |
| panel.grid.minor.y | element_line() | 水平次网格线 |
| aspect.ratio | 数值(m/n,两个整数) | 图像宽高比 |
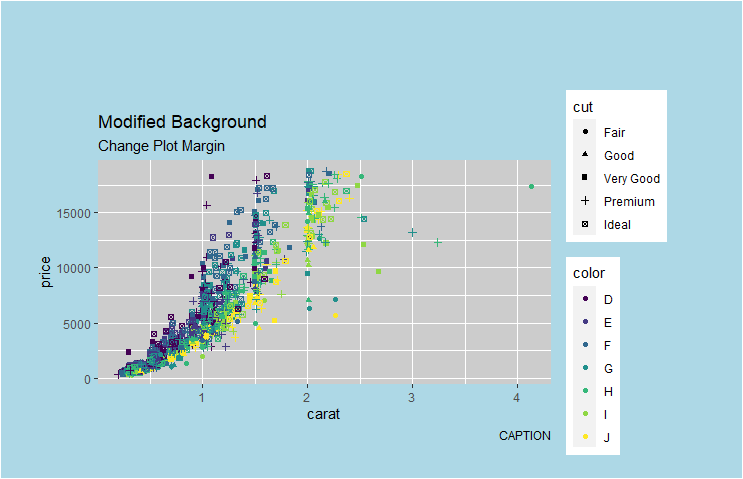
3.1 更改绘图背景
1 | p + theme(panel.background = element_rect(fill = 'grey80'), |
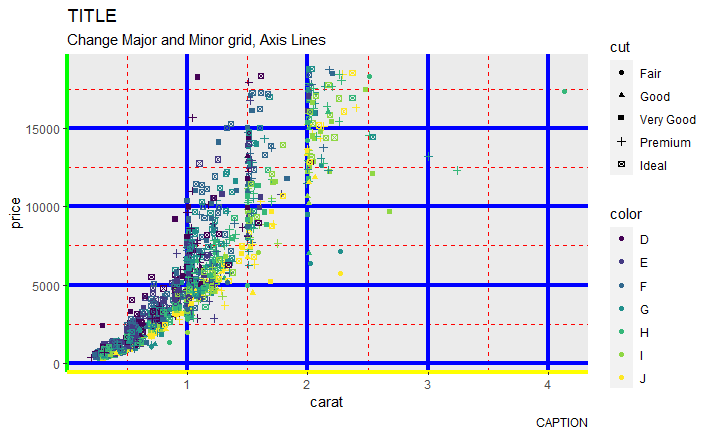
3.2 更改主次网格线以及X、Y坐标轴
1 | p + theme(panel.grid.major = element_line(colour = "blue", linewidth=1.5), #主网格线 蓝色 |
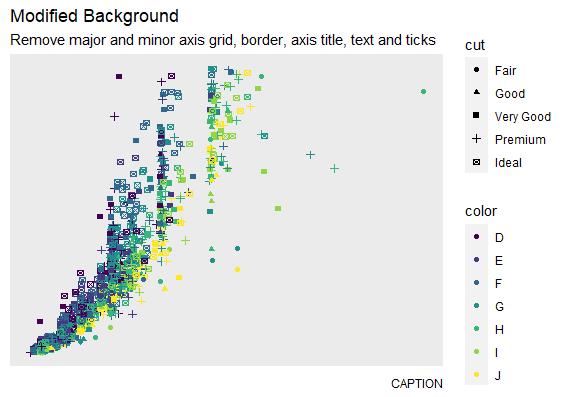
3.3 删除主次网格线
1 | p + theme(panel.grid.major = element_blank(), #主网格线 |
4. 分面组件
利用facet绘制多个图像时使用。
| 组件 | 对应的element_功能() | 描述 |
|---|---|---|
| strip.background | element_rect() | 分面标签背景 |
| strip.text | element_text() | 条状文本 |
| strip.text.x | element_text() | 水平条状文本 |
| strip.text.y | element_text() | 竖直条状文本 |
| panel.spacing | unit() | 分面间边距 |
| panel.spacing.x | unit() | 竖直分面间边距 |
| panel.spacing.y | unit() | 水平分面间边距 |
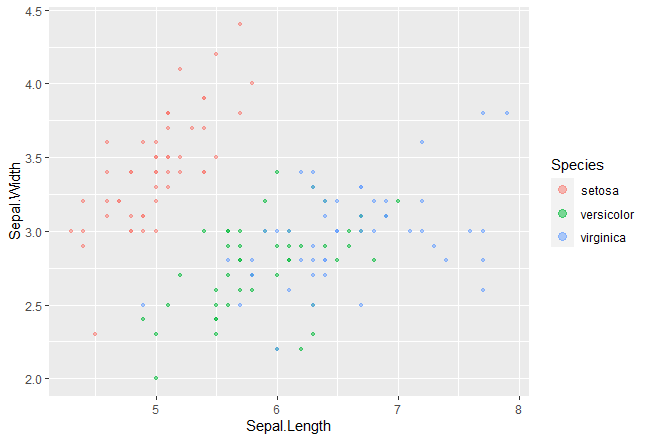
5. gides()
在ggplot2中,美学映射相应的标度函数可以调整图形本身的效果的同时调整图例的外观,但是有时候只想改变图例的外形,并不想影响图形的效果,这时就可以使用guides()函数。
override.aes()可以只修改图例中的外观,例如size、shape等等,而图形本身的外观不受影响。
1 | iris %>% |
如果是多个参数,用list就可以。
1 | iris %>% |
参考资料: