这一篇介绍ggplot2中与坐标相关的设置。
1. coord_catesian()
默认情况下使用scoord_cartesian这个坐标系。以下两个等价:
1 | p |
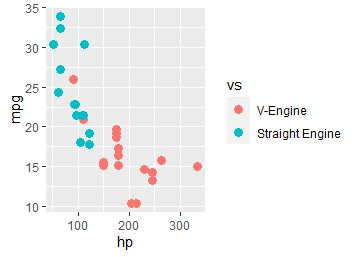
参数:
1 | coord_cartesian( |
xlim和ylim控制图片显示的区域范围,加上xlim和ylim之后,图如下:
1 | p+coord_cartesian(xlim = c(100,150),ylim = c(20,25),expand = T) |
注:coord_cartesian()的limits并不改变数据本身,只是相当于放大镜的作用,但是scale_x_continuous()中的limits会将指定范围之外的点全部变成NA,改变了原始数据,这样的话对数据进行统计时就会和原数据不一样。
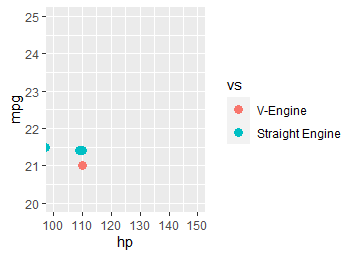
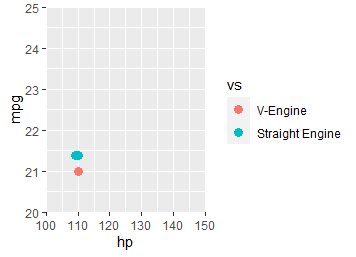
expand 为T则默认指定xlim轴两端还留一些空隙,F则控制范围即为图形的边缘。
1 | p+coord_cartesian(xlim = c(100,150),ylim = c(20,25),expand = F) |
2. coord_fixed()
coord_fixed()图形伸缩变换。
1 | coord_fixed(ratio = 1, xlim = NULL, ylim = NULL, expand = TRUE, clip = "on") |
ratio值表示y/x,即y周1单位是x周一单位的几倍,ratio越小,图形越扁。
1 | p+coord_fixed(ratio=1) |
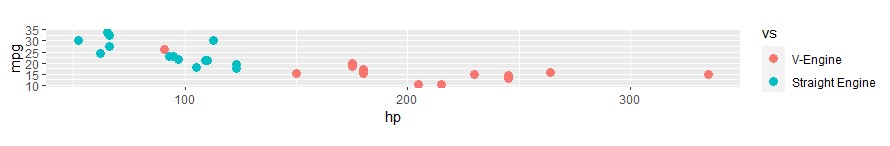
1 | p+coord_fixed(ratio=10) |
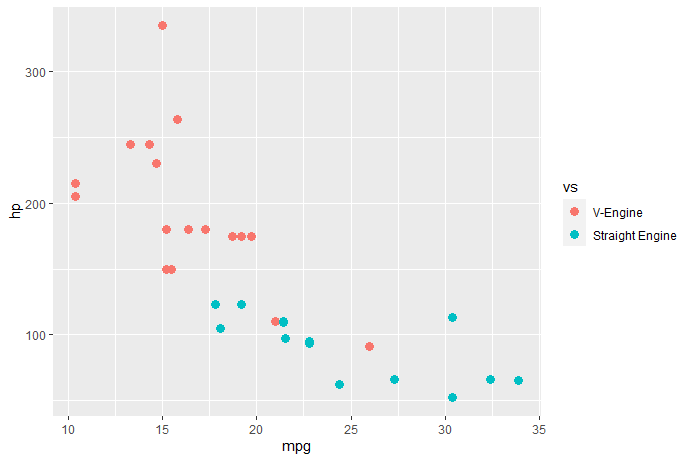
3.coord_flip()
横纵轴位置互换。
1 | coord_flip(xlim = NULL, ylim = NULL, expand = TRUE) |
1 | p + coord_flip() |
4. coord_trans()
坐标形式转换:例如对数转换,平方根转换等等log10、log2、squal。
1 | coord_trans( |
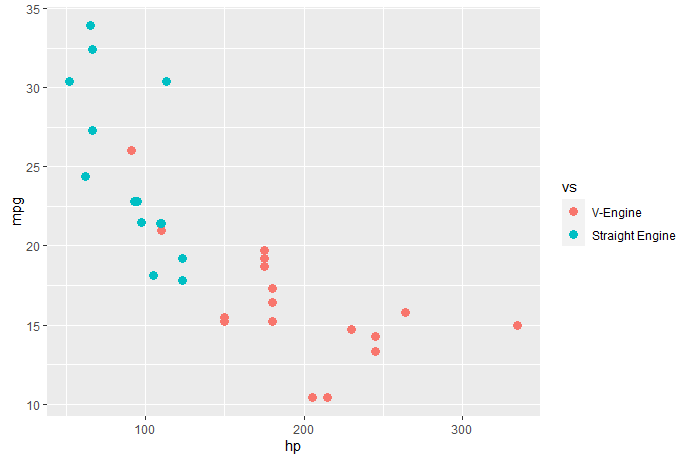
转换前:
1 | p |
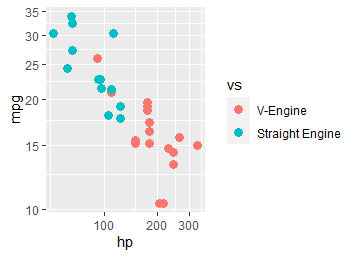
转换后:
1 | p + coord_trans(x="log2",y="log2") |
和scale_x_log的区别
- 后者等价于先将数据取对数,再拿进来处理,前者则是其他处理优先,最后作图时再取对数。
- 以拟合曲线为例:
如果用scale_x_log10就相当于把x的数据取了对数放进来做回归,拟合出一条直线。 - 如果使用coord_trans则是先用原有数据进行回归,得到一条拟合直线之后再变换坐标轴。
5. coord_equal()
等坐标转换:使用这个函数后,x轴和y轴坐标会被转换成相等形式,此时图形会产生较大的缩放,radio可以进一步调整缩放比例(x和y的比值)。
1 | p |
1 | p + coord_equal() |
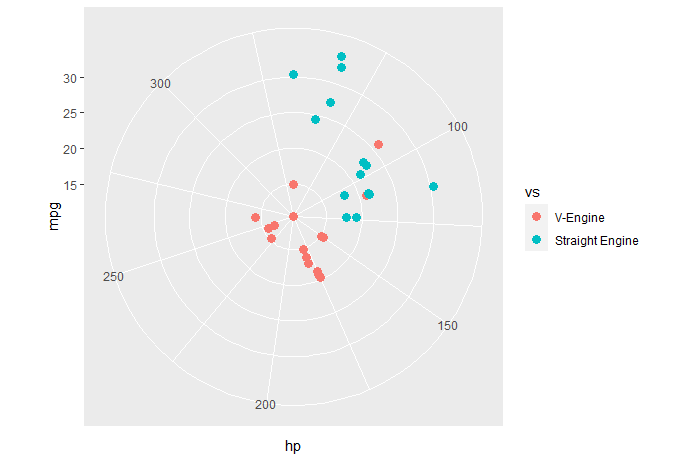
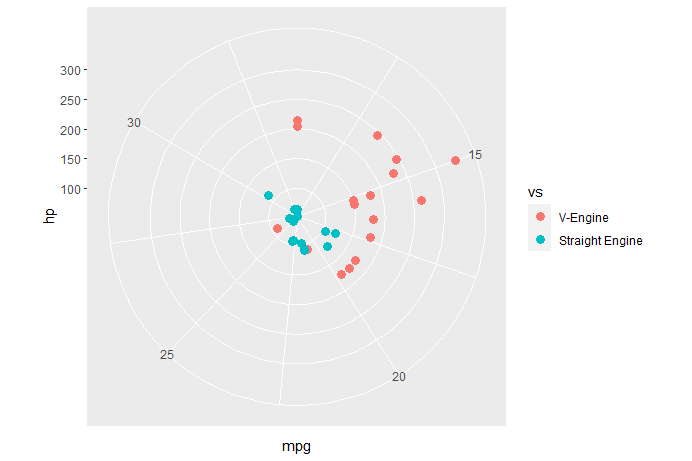
6. coord_polar()
进行极坐标转换,可以绘制饼图,参数方面theta可以选择x或y,表示外延的坐标,start是坐标开始的角度,默认其实位置是12点钟。direction 表示数据的方向,1是顺时针,-1为逆时针。
1 | coord_polar(theta = "x", start = 0, |
theta=”x”:
1 | p + coord_polar() |
theta=”y”:
1 | p + coord_polar(theta="y") |
饼图用theta=”y”,两张图最外圈坐标的变化,是由theta参数的选择来决定的。
参考资料: