本文总结了ggplot2包绘图时scale_相关设置。
scale_主要用于在ggplot画图之后对各个图层进行调整。常用的有: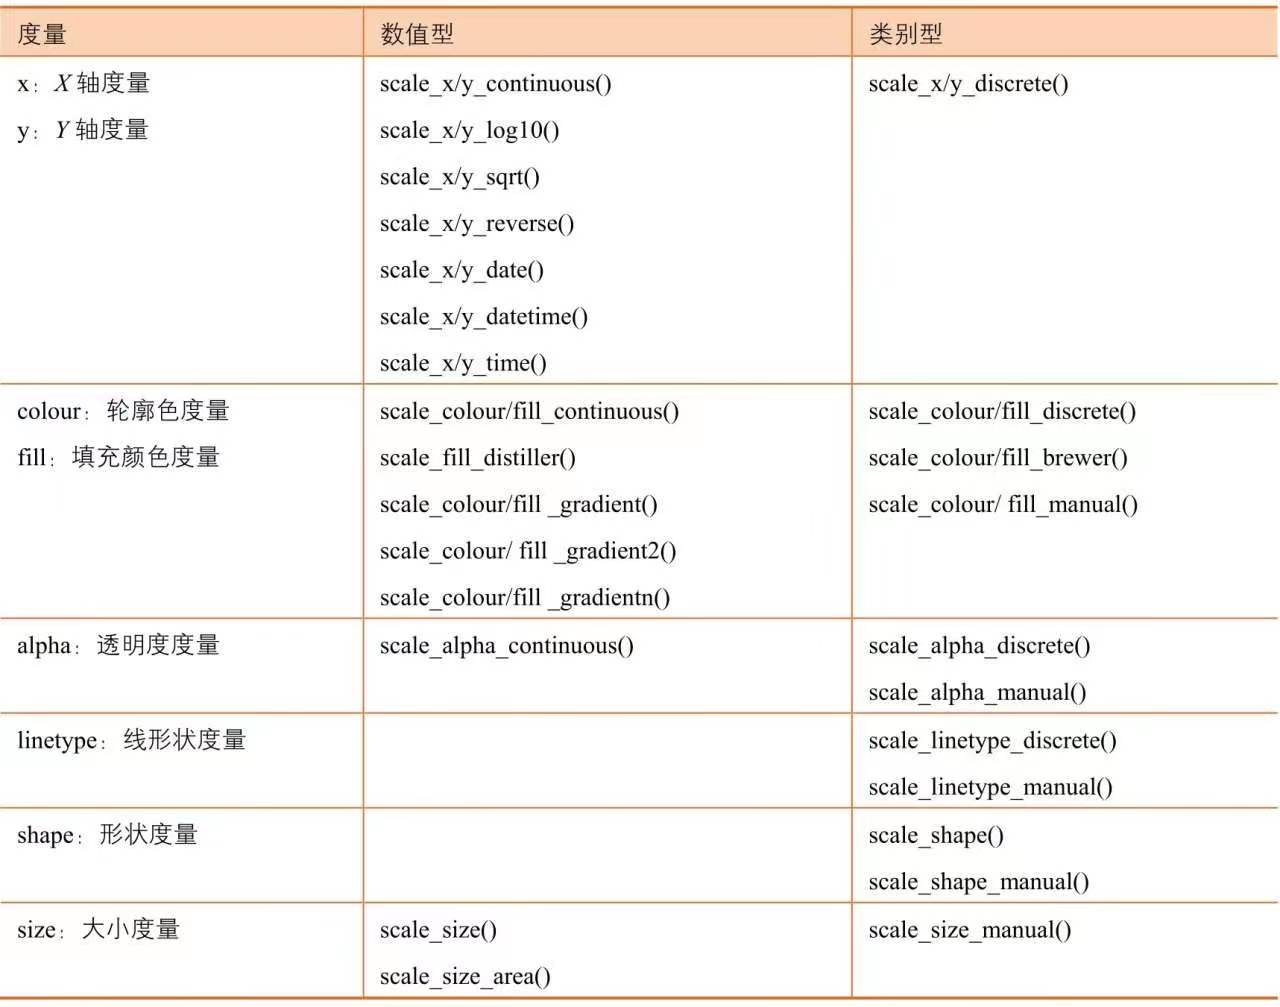
1.1 属性相关的scale设置
包括scale_size()、scale_alpha()、scale_shape()。这三个设置主要对ggplot的图层属性进行相关设置,包括尺寸、透明度和形状。
以下列出该设置的主要参数:
1 | scale_xxx(name = waiver(), breaks = waiver(), labels = waiver(), limits = NULL, range = c(1, 6),.....) |
由上面参数可以看出,我们可以对该属性进行,name命名,breaks设置组别,labels组别标签,limits限定坐标轴范围或组别排序,这几个参数在大多数scale设置中基本上都会用到。range设置尺寸大小范围(如点图的点),这个参数在其他设置中相对少见。
1.1.1 scale_size
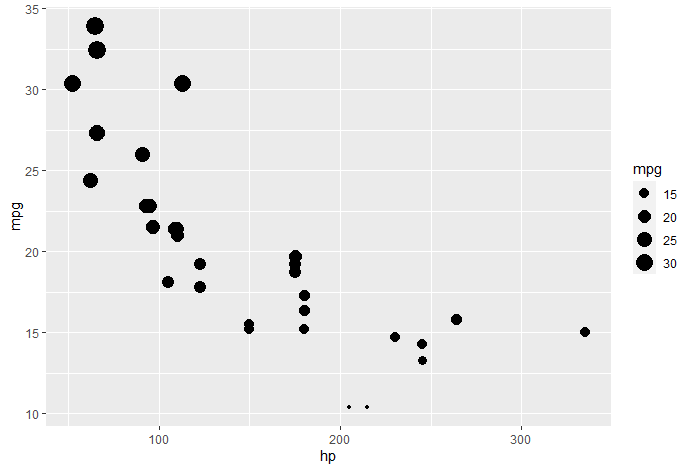
下面提供些例子作为参考:以R自带的mtcars数据集作为样本
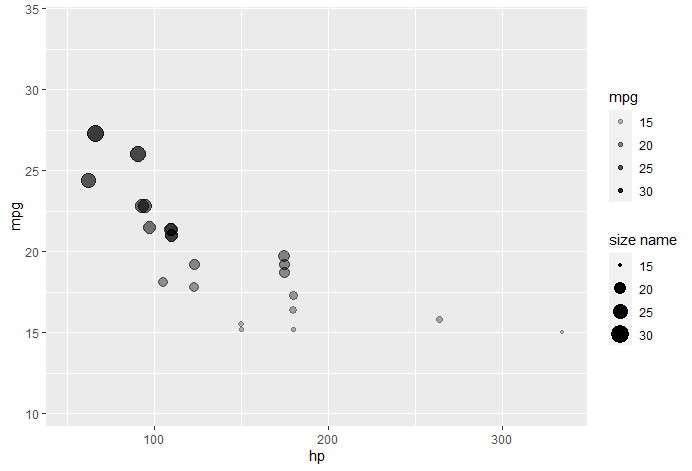
1 | ggplot(data=mtcars, aes(x=hp, y=mpg,size=mpg)) + |
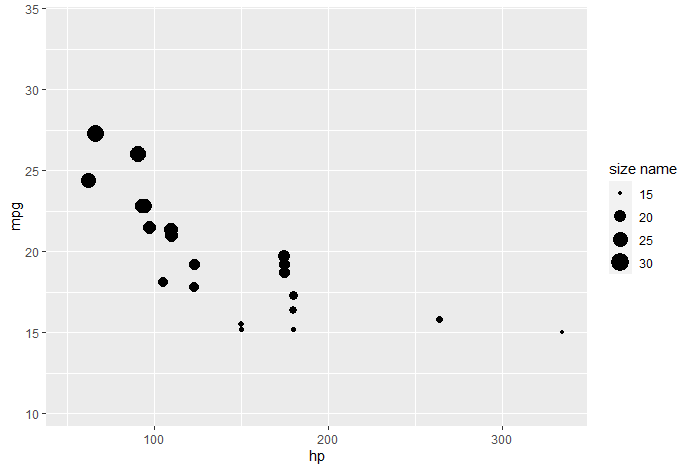
修改size的图例为”size name”,同时使用limits将size进行限定,只有在limits设置范围内的数据会被保留。
1 | ggplot(data=mtcars, aes(x=hp, y=mpg,size=mpg)) + |
range参数通过缩放修改点的大小。
1 | ggplot(data=mtcars, aes(x=hp, y=mpg,size=mpg)) + |
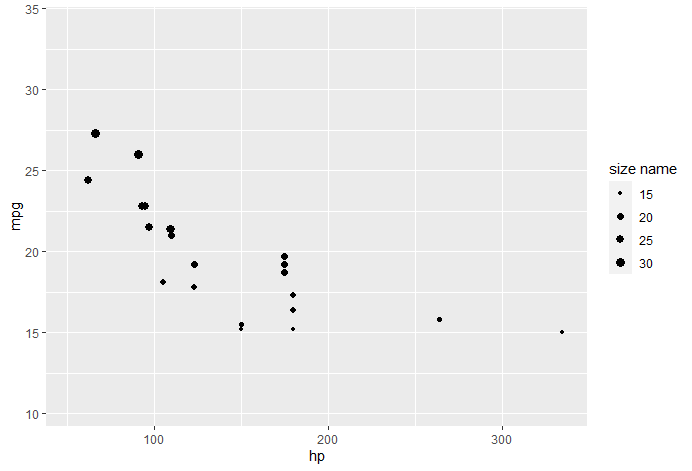
limits设置是针对数据的范围进行裁剪,而range设置纯粹的针对点的大小。scale_size()基本只用于散点图,同时与之对应的还有一个scale_radius()是对点进行设置半径,相比较而言scale_radius()基本上很少用到。最后scale_size诸多设置也可以用scale_size_area()进行设置。
1.1.2 scale_alpha
alpha调整点的透明度,scale_alpha与scale_alpha_continuous()等价,参数如下:
1 | scale_alpha(..., range = c(0.1, 1)) |
关于alpha参数的其他设置如name、breaks等归进continuous_scale()、binned_scale()、 discrete_scale()函数,区别在于alpha分组的变量是连续型(数值型)还是离散型(如文本类型)。
1 | continuous_scale( |
例如,连续型:
1 | ggplot(data=mtcars, aes(x=hp, y=mpg,size=mpg,alpha=mpg)) + |
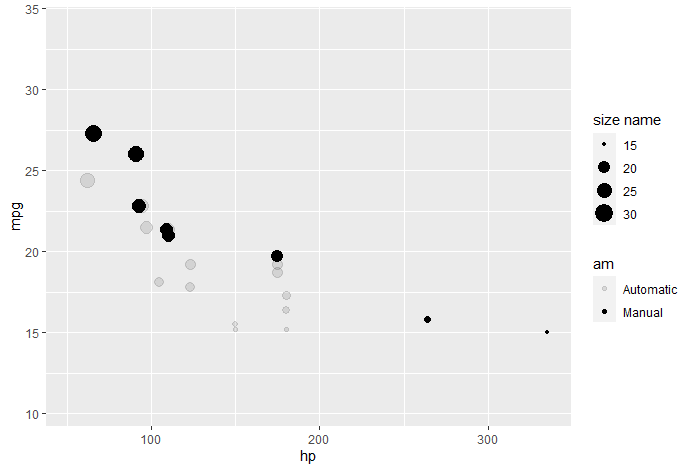
离散型:
1 | ggplot(data=mtcars, aes(x=hp, y=mpg,size=mpg,alpha=am)) + |
1.2.3 scale_shape
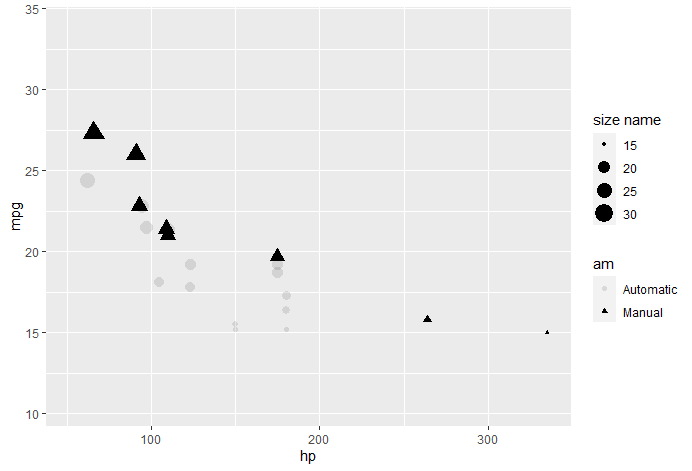
scale_shape只能用于离散型变量,例如:
1 | ggplot(data=mtcars, aes(x=hp, y=mpg,size=mpg,alpha=am,shape=am)) + |
1.2 scale-坐标转换
在R中坐标轴转换形式多样,如对数转换、平方根转换、坐标刻度前后调换等。
用到的函数有(*:x/y):
- scale_*_log10()
- scale_*_reverse()
- scale_*sqrt()
以上函数都是基于scale*_continuous()的,具体参数如下:以上的坐标轴转换可以通过scale_*_continuous()的trans参数实现。1
2
3
4
5
6
7
8
9
10
11
12
13
14
15scale_x_continuous(
name = waiver(),
breaks = waiver(),
minor_breaks = waiver(),
n.breaks = NULL,
labels = waiver(),
limits = NULL,
expand = waiver(),
oob = censor,
na.value = NA_real_,
trans = "identity",
guide = waiver(),
position = "bottom",
sec.axis = waiver()
)
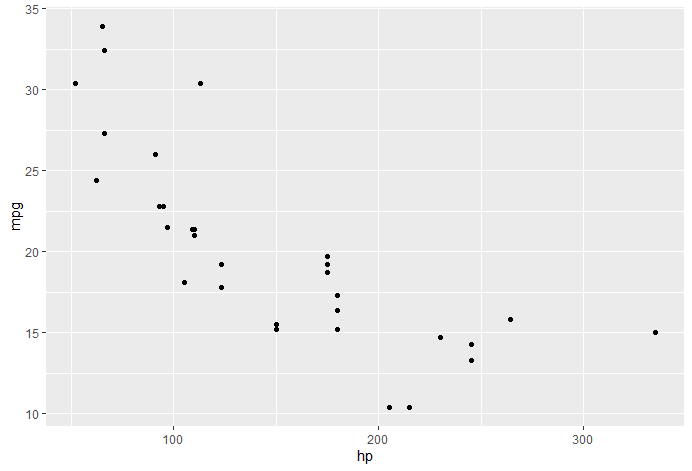
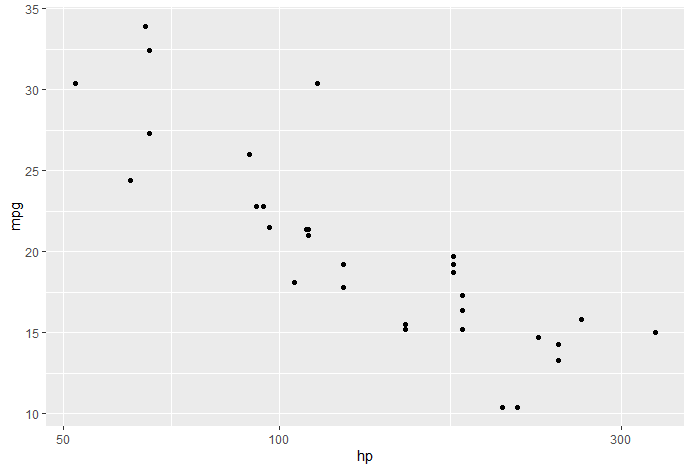
例如,转换前:
1 | ggplot(data=mtcars, aes(x=hp, y=mpg)) + |
以下log10转换后,两个效果一样,如下图:
1 | ggplot(data=mtcars, aes(x=hp, y=mpg)) + |
此外,借助coord_trans()函数,可以直接对x和y轴进行不同设置,如图:
1 | ggplot(data=mtcars, aes(x=hp, y=mpg)) + |
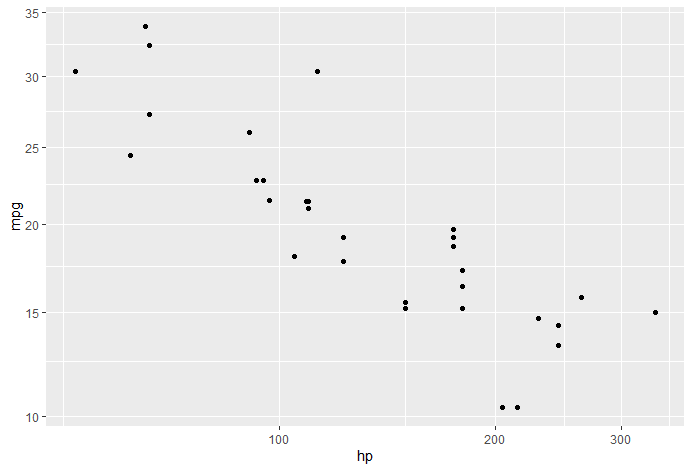
注:这样转变之后的坐标轴刻度并不会改变,只是将点进行缩放,如果要改变坐标轴刻度,可以直接在aes中改变。
ggplot(data=mtcars, aes(x=loog10(hp), y=sqrt(mpg))) + geom_point()
1.3 scale-时间设置
在scale设置中,常用的日期方面的设置函数包括:scale_x_date(),scale_y_date(),scale_x_datetime(),scale_y_datetime()
1 | scale_x_date(name = waiver(), breaks = waiver(), date_breaks = waiver(), labels = waiver(), date_labels = waiver(), minor_breaks = waiver(), date_minor_breaks = waiver(), limits = NULL, expand = waiver()) |
常用的设置参数有:name,breaks,labels,limits等,另外,特有的参数包括,date_labels,date_breaks,minor_breaks,date_minor_breks。从作用来说,date_breaks和breaks作用是一样的,如果两个参数同时出现在一个scale设置中,函数会默认优先使用date_breaks的参数内容。
minor_breaks()和date_minor_breaks()是在原有坐标轴刻度的基础上,绘制出子刻度。比如你的breaks 可能是以月为单位,minor_breaks可以设置为以日为单位,这样就可以在所画的图中看出更为精确的数据图形。
1 | df <- data.frame(date = Sys.Date() - 0:29, |
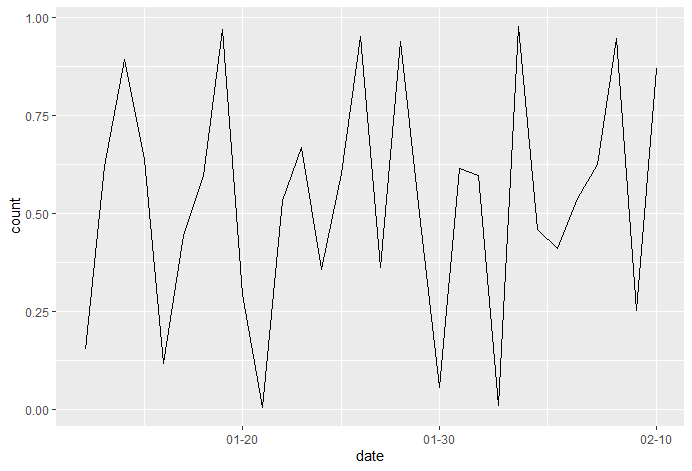
1 | ggplot(df, aes(date, count)) + |
以上两段代码绘制出相同的图: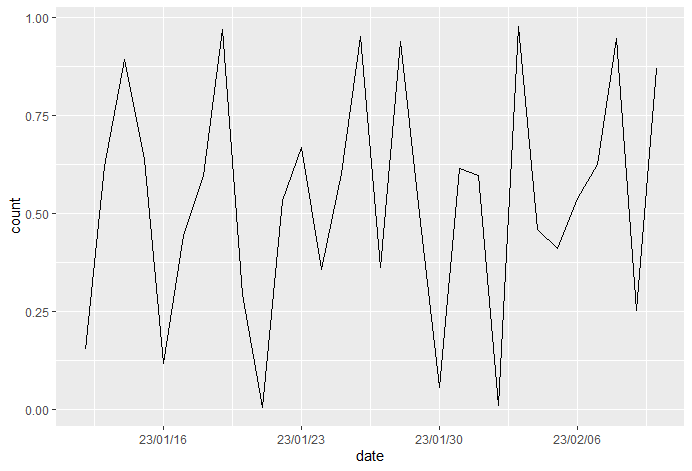
1、在lables和date_labels同时出现的情况下,系统会优先使用date_labels设置
2、在时间设置方面,date_labels,以及date_breaks 设置要比 labels和breaks设置要简洁得多。
1.4 scale-手动设置
在ggplot2 中,可以进行手动设置的函数有:scale_colour_manual(…, values)、scale_fill_manual(…,values)、scale_size_manual(…,values) scale_shape_manual(…,values)、scale_linetype_manual(…,values)、scale_alpha_manual(…,values)、scale_color_manual(…,values)。
基本上所有的属性设置,都可以进行手动设置。另外从以上的参数来看,手动设置函数,除了正常的参数以外,还有一个values参数,参数values的值可以是名称或者数字,名称用于指定相关设置选项的名称,数值则表示指定范围。通常用于设置图例。
以颜色为例scale_color_manual():
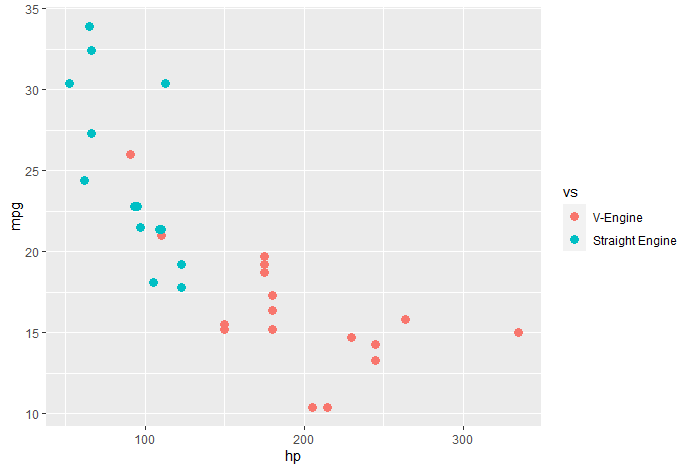
1 | p <- ggplot(data=mtcars, aes(x=hp, y=mpg, color=vs)) + |
直接手动改变颜色:
1 | p+scale_colour_manual(values=c("red","blue")) |
通过数字改变:
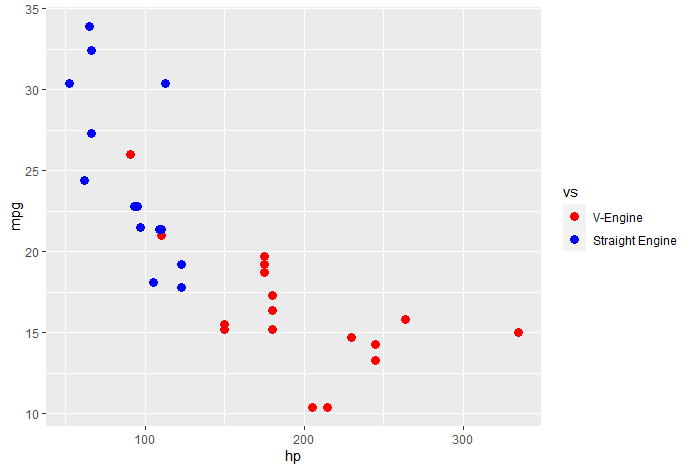
1 | p + scale_color_manual(values = c(2:3)) |
直接对因子变量直接进行赋值:
1 | p+scale_colour_manual(values=c("V-Engine"="red","Straight Engine"="blue")) |
1.5 scale-颜色设置
在ggplot的scale设置中,颜色相关的函数较多:
scale_color/fill_manual(手动更改颜色)、scale_color/fill_hue(通过更改色度)、scale_color_brewer(更改色盘)、scale_color/fill_discrete(离散型)、scale_color/fill_continuous、scale_color/fill_gradient等等,continuous和gradient是一样的。
1.5.1 scale_color_hue
参数详解:
- h表示色彩变化范围,变化范围为(0,360)
- c表示色彩的浓度,由数据的最大值决定
- l 表示色彩的亮度,变化范围为(0,100)
- direction 为1表示色彩是顺时针,-1表示逆时针
1
2
3
4
5
6
7
8scale_colour_hue(...,
h = c(0, 360) + 15,
c = 100,
l = 65,
h.start = 0,
direction = 1,
na.value = "grey50",
aesthetics = "colour")
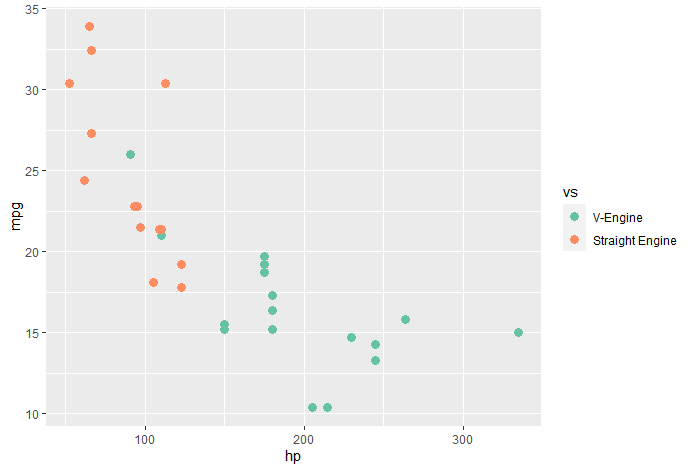
1 | p <- ggplot(data=mtcars, aes(x=hp, y=mpg, color=vs)) + |
1.5.2 scale_color_brewer
参数详解:
- type表示颜色样式 有seq 、 div 、qual 三个中选一个,”seq” (sequential), “div” (diverging) or “qual” (qualitative)
- palette 表示颜色数量,数字直接表示颜色个数,也可以用相对应的名称例如:
1
2
3
4
5scale_colour_brewer(...,
type = "seq",
palette = 1,
direction = 1,
aesthetics = "colour")1
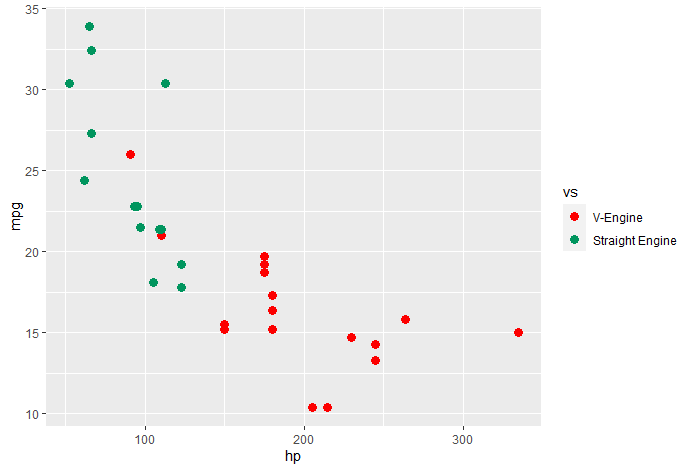
p+scale_color_brewer(type="seq",palette="Set2")
1.5.3 scale_color_gradient
scale_n_gradient以两种颜色为梯度(low,high),scale_n_gradient2()以三种颜色为梯度(low,mid,high),scale_*gradientn()以n种颜色作为梯度。
参数详解:
- low 表示颜色梯度最底端的颜色
- high 表示颜色梯度最高位置的颜色
- space 表示颜色梯度计算空间,通常用lab 都是最好的
- guide 该参数的值可以用colourbar 表示用颜色条,legend可以表示为离散变量
1
2
3
4
5
6
7
8
9
10
11
12
13
14
15
16
17
18
19
20
21
22
23
24
25
26scale_colour_gradient(...,
low = "#132B43",
high = "#56B1F7",
space = "Lab",
na.value = "grey50",
guide = "colourbar",
aesthetics = "colour")
scale_colour_gradient2(...,
low = muted("red"),
mid = "white",
high = muted("blue"),
midpoint = 0,
space = "Lab",
na.value = "grey50",
guide = "colourbar",
aesthetics = "colour")
scale_colour_gradientn(...,
colours,
values = NULL,
space = "Lab",
na.value = "grey50",
guide = "colourbar",
aesthetics = "colour",
colors)
例如:
1 | p <- ggplot(data=mtcars, aes(x=hp, y=mpg, color=mpg)) + |
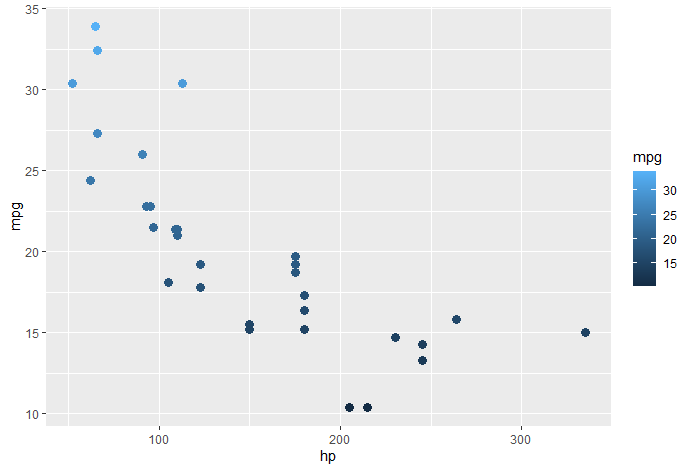
两种颜色的梯度:
1 | p + scale_color_gradient(low="red",high="blue") |
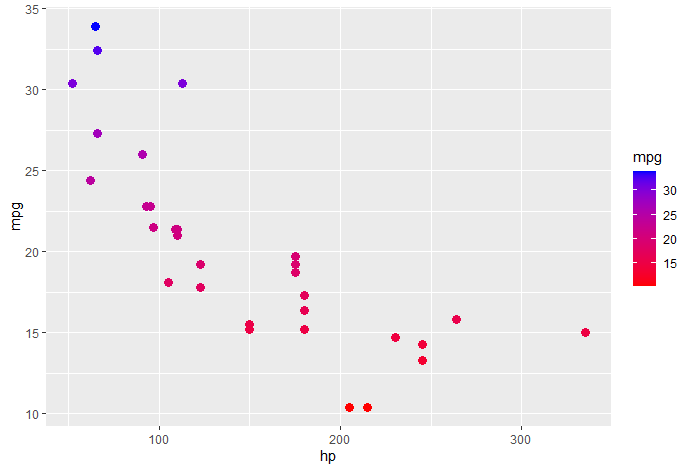
三种颜色的梯度:
1 | p + scale_color_gradient2(low=muted("red"),mid="white",high=muted("blue")) |
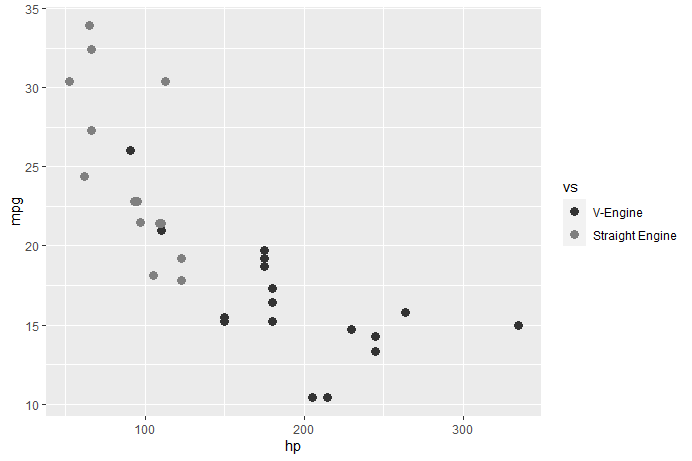
1.5.4 scale_color_grey
grey的设置是对颜色进行灰度设置,另外,值得注意的是start和end的参数只能在0到1之间进行取值。
把颜色设置成灰度面板。
1 | scale_colour/fill_grey(..., start = 0.2, end = 0.8, na.value = "red") |
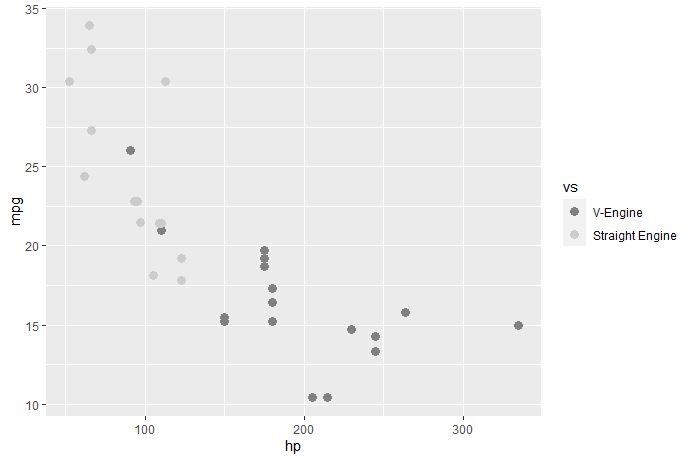
- start 从调色板的最低端颜色开始(颜色最浅开始)
- end 到调试板最高位置的颜色(颜色最深开始)
例如:1
p + scale_color_grey(end=0.5)
1 | p + scale_color_grey(start =0.5) |
scale还有其他的各种作用,例如,scale_x_break()、scale_y_break()可以对坐标轴进行截断。
参考资料: