Pandas 是一个开源的第三方 Python 库,从 Numpy 和 Matplotlib 的基础上构建而来。Pandas 这个名字来源于面板数据(Panel Data)与数据分析(data analysis)这两个名词的组合,Pandas可以提供一个简单、高效、带有默认标签(也可以自定义标签)的 DataFrame 对象。本文总结了Pandas学习笔记。
1. Pandas内置数据结构
Pandas内置的数据结构有两种,Series和DataFrame,分别是一维数据结构和二维数据结构。
| 内置变量 | 描述 |
|---|---|
| Series(一维) | 该结构类似一维数组,能够存储各种数据类型,比如字符数、整数、浮点数、Python 对象等,Series 用 name 和 index 属性来描述数据值。Series 是一维数据结构,因此其维数不可以改变。 |
| DataFramse(二维) | DataFrame 是一种二维表格型数据的结构,既有行索引,也有列索引。行索引是 index,列索引是 columns。在创建该结构时,可以指定相应的索引值。 |
二者结构如图所示:
Series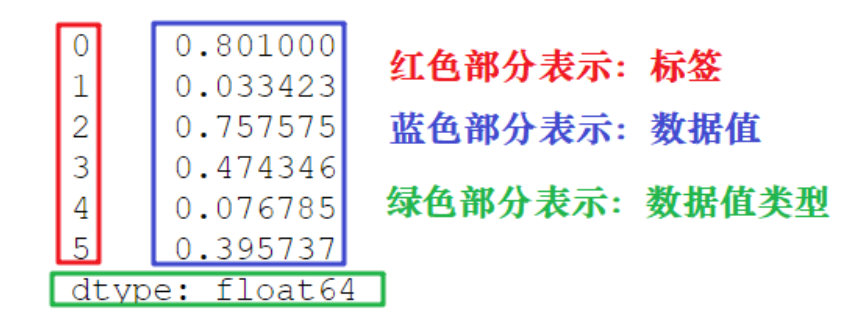
图片来源
DataFrame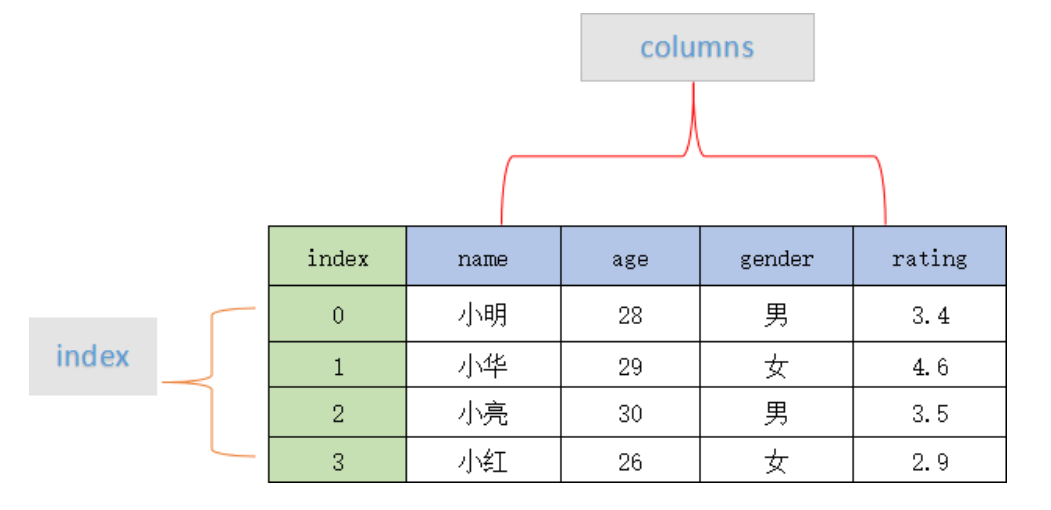
图片来源
2 创建Series对象
2.1 Series()函数创建Series对象
1 | > import pandas as pd |
| 参数 | 描述 |
|---|---|
| data | 输入的数据,可以是列表、常量、ndarray 数组等。 |
| index | 索引值必须是惟一的,如果没有传递索引,则默认为 np.arrange(n)。 |
| dtype | dtype表示数据类型,如果没有提供,则会自动判断得出。 |
| copy | 表示对 data 进行拷贝,默认为 False。 |
1 | > a = pd.Series([5,6,7,8]) |
2.2 获取数据和索引
1 | > a.index |
2.3 修改索引
1 | > a = pd.Series(a.values,index=[10,11,12,13]) |
Series还可以使用显示索引。
1 | > a = pd.Series(a.values,index=['a','b','c','d']) |
2.4 使用dict创建Series对象
1 | > dict = {'a':1,'b':2,'c':3,'d':4} |
2.5 访问元素
1 | # 位置索引 |
2.6 Series常用属性
常用属性如下:
| 名称 | 属性 |
|---|---|
| axes | 以列表的形式返回所有行索引标签。 |
| dtype | 返回对象的数据类型。 |
| empty | 返回一个空的 Series 对象。 |
| ndim | 返回输入数据的维数。 |
| size | 返回输入数据的元素数量。 |
| values | 以 ndarray 的形式返回 Series 对象。 |
| index | 返回一个RangeIndex对象,用来描述索引的取值范围。 |
1 | > b.axes |
3 创建DataFrame对象
3.1 DataFrame()函数创建DataFrame对象
1 | aa = pd.DataFrame(data,index,columns,dtype,copy) |
| 参数 | 描述 |
|---|---|
| data | 输入的数据,可以是 ndarray,series,list,dict,标量以及一个 DataFrame。 |
| index | 行标签,如果没有传递 index 值,则默认行标签是 np.arange(n),n 代表 data 的元素个数。 |
| columns | 列标签,如果没有传递 columns 值,则默认列标签是 np.arange(n)。 |
| dtype | dtype表示每一列的数据类型。 |
| copy | 默认为 False,表示复制数据 data。 |
- 单一列表创建
1
2
3
4
5
6
7
8
9> data = [1,2,3,4,5]
> aa = pd.DataFrame(data)
> aa
0
0 1
1 2
2 3
3 4
4 5 - 嵌套列表创建
1
2
3
4
5
6
7
8
9
10
11
12
13
14
15
16> data = [['a',1],['b',2],['c',3],['d',4]]
> bb = pd.DataFrame(data)
> bb
0 1
0 a 1
1 b 2
2 c 3
3 d 4
## 添加列名
> bb = bb.DataFrame(data,columns=['char','num'])
> bb
char num
0 a 1
1 b 2
2 c 3
3 d 4 - 字典嵌套列表创建
1
2
3
4
5
6
7
8
9
10
11
12
13
14
15> data = {'char':['a','b','c','d'],'num':[1,2,3,4]}
> bb = pd.DataFrame(data)
char num
0 a 1
1 b 2
2 c 3
3 d 4
## 添加行名
> bb = pd.DataFrame(data,index=['row1','row2','row3','row4'])
> bb
char num
row1 a 1
row2 b 2
row3 c 3
row4 d 4 - 列表嵌套字典创建
1
2
3
4
5
6
7
8
9
10
11
12
13
14
15
16
17
18
19
20
21
22
23
24
25
26
27> data = [{'a':1,'b':2},{'a':5,'b':3,'c':2}]
> cc = pd.DataFrame(data)
> cc
a b c
0 1 2 NaN
1 5 3 2.0
> cc = pd.DataFrame(data,index=['row1','row2'])
> cc
a b c
row1 1 2 NaN
row2 5 3 2.0
> cc = pd.DataFrame(data,index=['row1','row2'],columns=['a','b','c'])
> cc
a b c
row1 1 2 NaN
row2 5 3 2.0
> cc = pd.DataFrame(data,index=['row1','row2'],columns=['a','b'])
> cc
a b
row1 1 2
row2 5 3
## columns要和字典的key对应,否则为NaN
> cc = pd.DataFrame(data,index=['row1','row2'],columns=['a','b2'])
> cc
a b2
row1 1 NaN
row2 5 NaN - Series创建DataFrame对象
1
2
3
4
5
6
7
8
9> data = {'col1':pd.Series([1,2,3],index=['a','b','c']),
'col2':pd.Series([4,5,6,7],index=['a','b','c','d'])}
> dd = pd.DataFrame(data)
> dd
col1 col2
a 1.0 4
b 2.0 5
c 3.0 6
d NaN 7
3.2 列索引
列索引访问数据列
1
2
3
4
5
6> dd['col1']
a 1.0
b 2.0
c 3.0
d NaN
Name: col1, dtype: float64列索引添加数据列
1
2
3
4
5
6
7
8
9
10
11
12
13
14
15
16
17
18
19
20
21
22
23
24
25## (1) df['name']=value
> dd['col3']=pd.Series([8,9,10],index=['a','c','d'])
> dd
col1 col2 col3
a 1.0 4 8.0
b 2.0 5 NaN
c 3.0 6 9.0
d NaN 7 10.0
> dd['col4'] = dd['col1']+dd['col3']
> dd
col1 col2 col3 col4
a 1.0 4 8.0 9.0
b 2.0 5 NaN NaN
c 3.0 6 9.0 12.0
d NaN 7 10.0 NaN
## (2) df.insert
> dd.insert(2,column='insert',value=[60,70,80,90])
> dd
col1 insert col2 col3 col4
a 1.0 60 4 8.0 9.0
b 2.0 70 5 NaN NaN
c 3.0 80 6 9.0 12.0
d NaN 90 7 10.0 NaN列索引删除数据列: del 和pop()
1
2
3
4
5
6
7
8
9
10
11
12
13
14
15
16
17
18
19
20> del dd['insert']
> dd
col1 col2 col3 col4
a 1.0 4 8.0 9.0
b 2.0 5 NaN NaN
c 3.0 6 9.0 12.0
d NaN 7 10.0 NaN
> dd.pop('insert')
a 9.0
b NaN
c 12.0
d NaN
Name: col4, dtype: float64
> dd
col1 col2 col3
a 1.0 4 8.0
b 2.0 5 NaN
c 3.0 6 9.0
d NaN 7 10.0
3.4 行索引
标签索引选取
将行标签传递给loc函数,来选取数据。1
2
3
4
5> dd.loc['b']
col1 2.0
col2 5.0
col3 NaN
Name: b, dtype: float64整数索引选取
将数据行所在的索引值传递给iloc函数。1
2
3
4
5
6
7> dd.iloc[1] # 行索引
col1 2.0
col2 5.0
col3 NaN
Name: b, dtype: float64
> dd.iloc[1,0] # 行索引,列索引
2.0切片选取多行
1 | > dd[1:] |
- 添加数据行
1 | > ee = pd.DataFrame([[1,2],[3,4]],columns=['col1','col2']) |
- 删除数据行
1 | > dd = dd.drop(0) #并不直接改变dd,而是返回删除行之后的dataframe |
3.5 DataFrame属性
常用的属性(≠函数)如下:
| 名称 | 属性&方法描述 |
|---|---|
| T | 行和列转置。 |
| axes | 返回一个仅以行轴标签和列轴标签为成员的列表。 |
| dtypes | 返回每列数据的数据类型。 |
| empty | DataFrame中没有数据或者任意坐标轴的长度为0,则返回True。 |
| ndim | 轴的数量,也指数组的维数。 |
| shape | 返回一个元组,表示了 DataFrame 维度。 |
| size | DataFrame中的元素数量。 |
| values | 使用 numpy 数组表示 DataFrame 中的元素值。 |
| head() | 返回前 n 行数据。 |
| tail() | 返回后 n 行数据。 |
| vshift() | 将行或列移动指定的步幅长度 |
1 | > dd.T |